Integrate with Power BI
Power BI is an analytics tool that transforms data into interactive visualizations and reports. Unlock deeper insights with Power BI integration, providing valuable insights into content operations performance, process efficiencies, and areas for optimization. Its user-friendly interface empowers organizations to analyze and share data effectively for improved business outcomes.
Prerequisites
You must have the Power BI desktop application, download from here.
Minimum Requirements for the Desktop App
-
Windows 10 or Windows Server 2016 or later.
-
.NET 4.7.2 or later.
-
Microsoft Edge browser.
-
Memory (RAM): At least 2 GB available, 4 GB or more is recommended.
-
Display: At least 1440x900 or 1600x900 (16:9) is required.
-
Windows Display Settings: If you set your display to change the size of text, apps, and other items to more than 100%, you will not see some dialogs that you must interact with to continue using Power BI desktop. If you encounter this issue, check your display settings in Windows by going to Settings > System > Display, and use the slider to return display settings to 100%.
-
CPU: 1 gigahertz (GHz) 64-bit (x64) processor or better recommended.
-
WebView2.
To learn more about the requirements and initial setup, click here.
License
You will need either a free license or any higher license (Pro or PPU) to publish the report. With the free license,
-
You can publish the report only to your workspace.
-
You cannot share the report, collaborate with other users, or consume any other report shared by other user(s).
Note: A Pro license is the minimum requirement if you want to share the report with others or publish it to any other workspace. To know more about licenses, click here.
Setup
Obtain the template that is created for the Operations report, and open it in the Power BI desktop application.
When the template is opened, enter the following:

-
InstanceURL - will be your Kapost instance URL, e.g: myinstance.kapost.com
-
KapostToken - will be the read-only token of Kapost instance admin, which can be obtained from the edit profile page
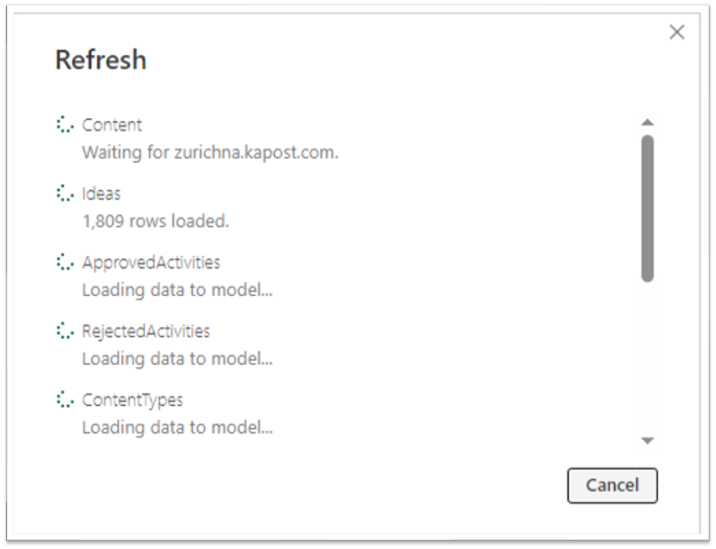
Once the details are provided, click Load. PowerBI will start making requests to Kapost to get the data via APIs and displays the loader window.
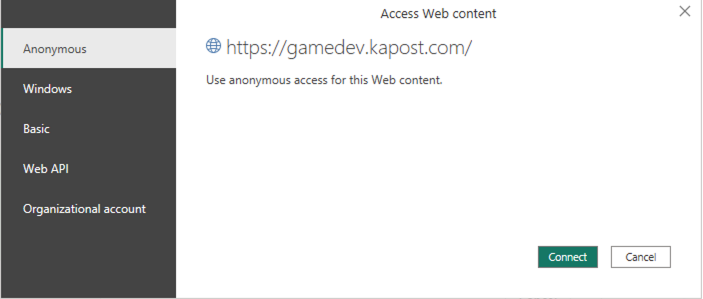
For the first time, Power BI will ask to set the credentials for the API calls, select the anonymous option and click on the Connect button.
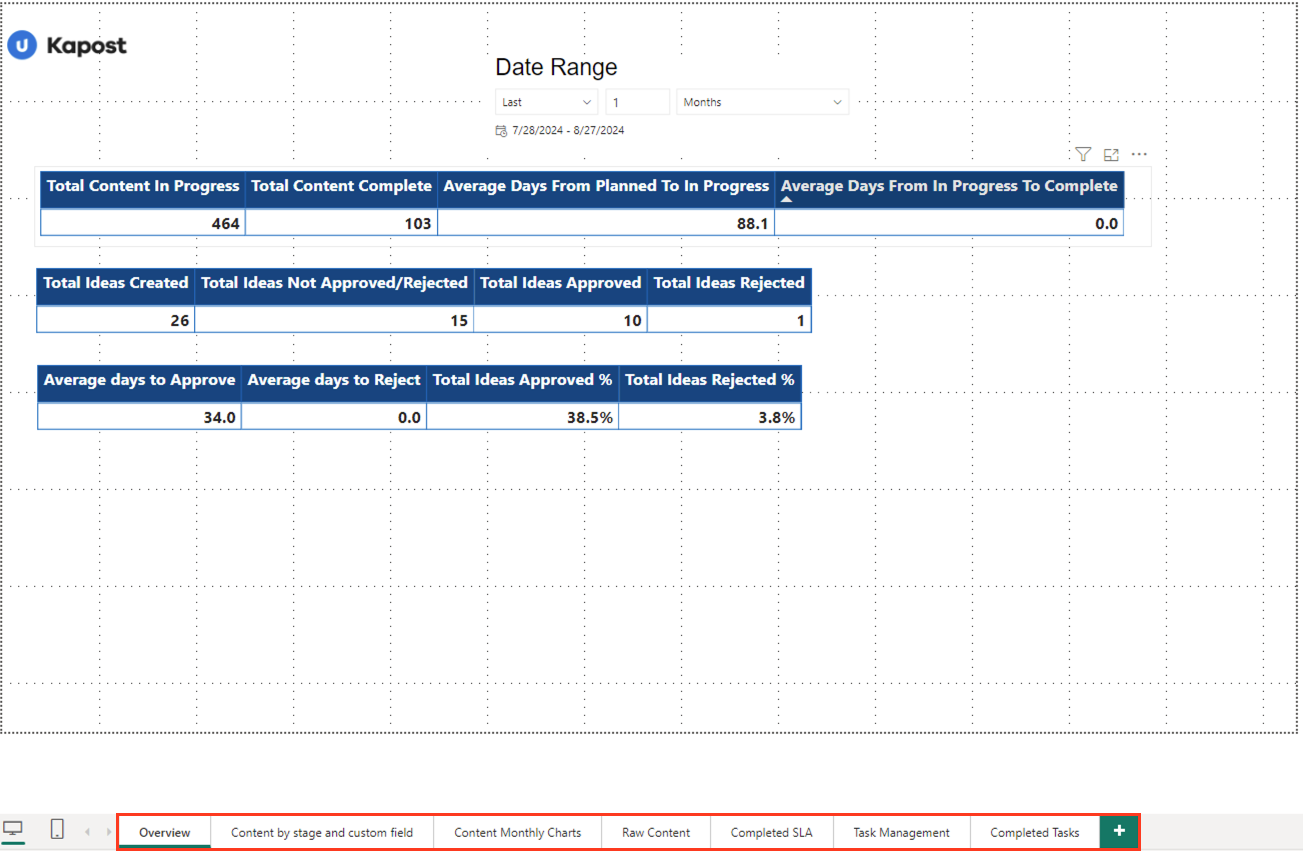
Once the data is loaded, you will be able to see the reports with various pages.
Modification
Anything in the report can be modified as per the requirement but if you want to adjust the decimal places for a decimal number, change the chart, or update the date filter then you can do that easily as described below.
Adjusting Decimal Place
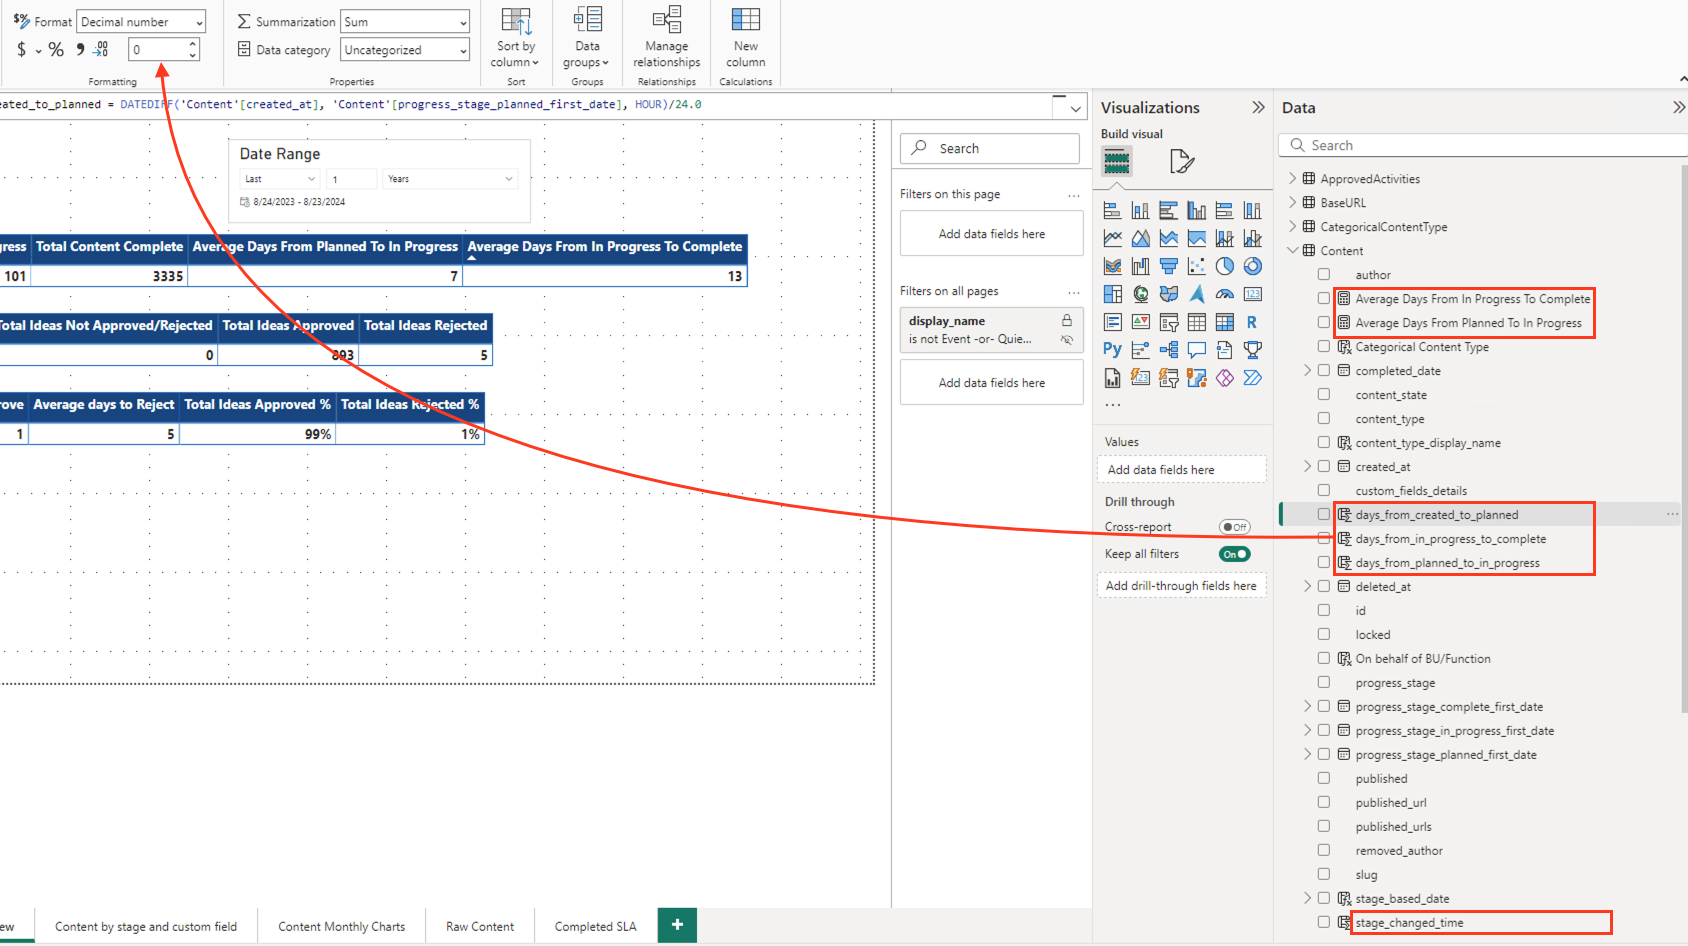
Some of the columns in the report are decimal numbers. If you want to adjust the decimal place for any of them, then it can be done by following the steps below:
-
Click on the decimal-type column. You will be able to see the “Format” option under “Column Tools” top menu.
-
Update the decimal place as desired.
Changing the Chart Type
Chart type can be changed by following the steps below:
-
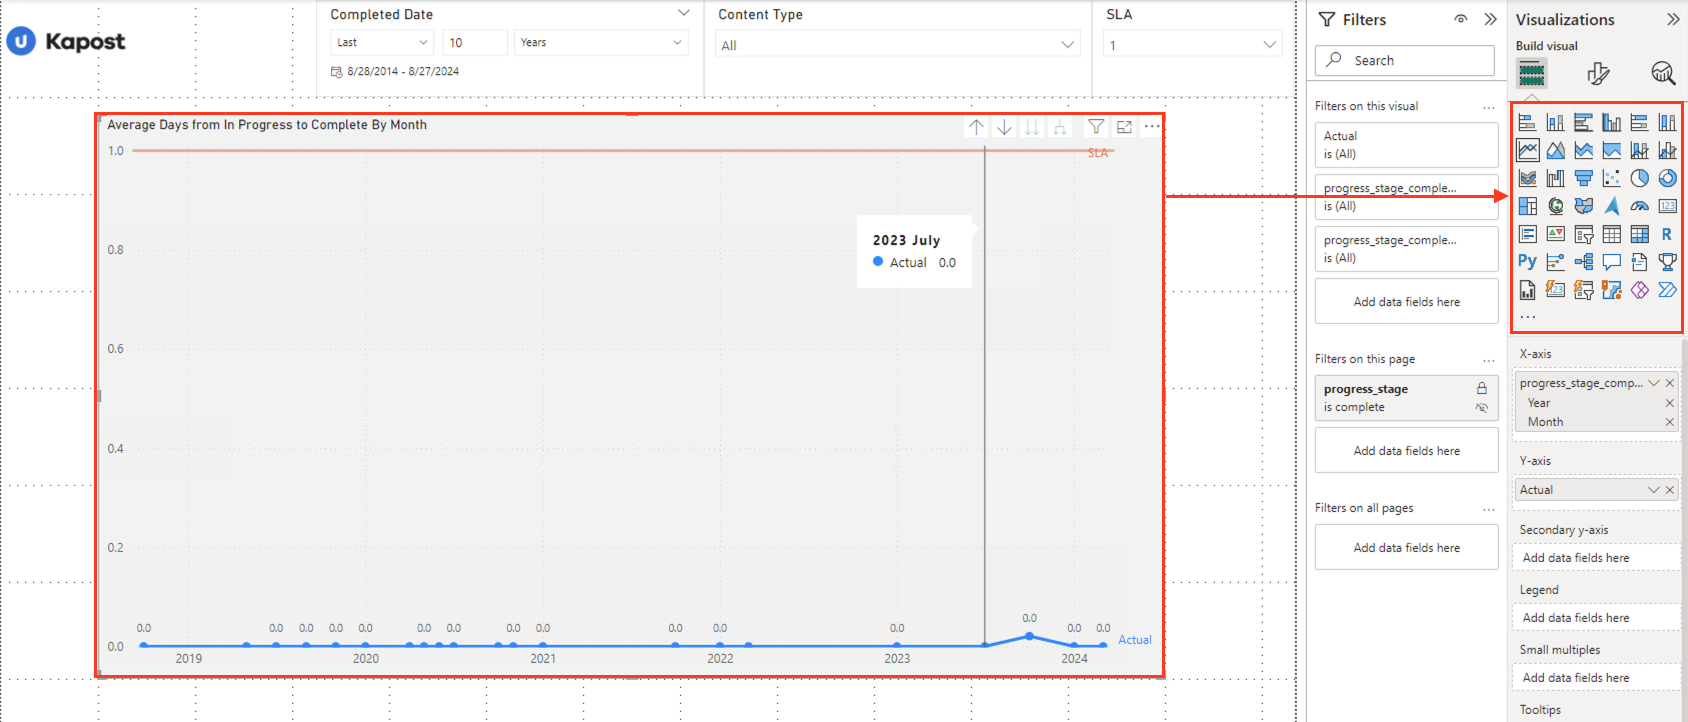
Click on the chart that needs to be changed.
-
Select the new chart type under Visualizations section.
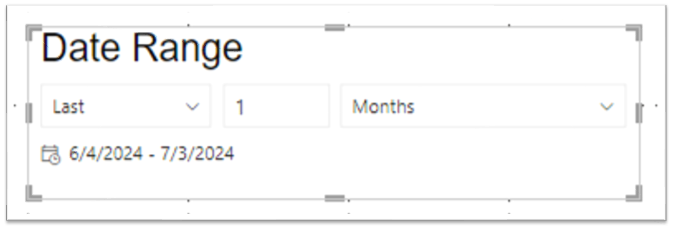
Date Slicer
On all the pages in Power BI, we have date slicers. Using the above slicer, we can filter the data for rolling dates.
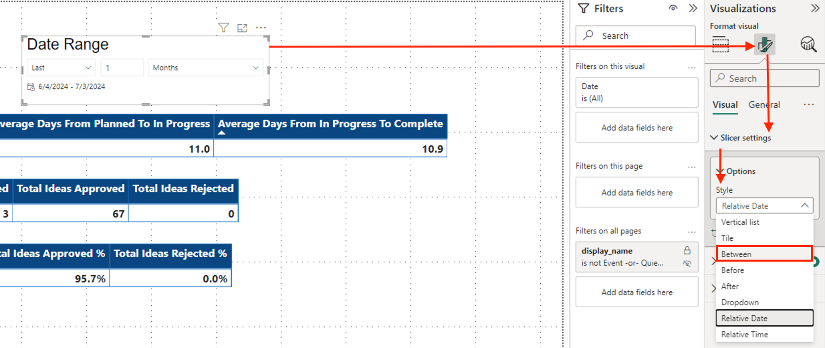
If you want to select a specific date range, then the slicer UI needs to be updated. Follow the steps below to make the change:
-
Select the Date Slicer.
-
Go to Visualization > Format Visual tab.
-
Under Slicer settings, go to Options > Style.
-
Select the Between option from the dropdown menu.
Note: The default option in the template is relative date.
After making the above changes, the date slicer will look like below:

Publishing the Report
Once you are done with the changes (if any) and want to share the report with others, you will need to save the report and publish the report to Power BI. Follow the steps below:
-
Click on the Publish button.

-
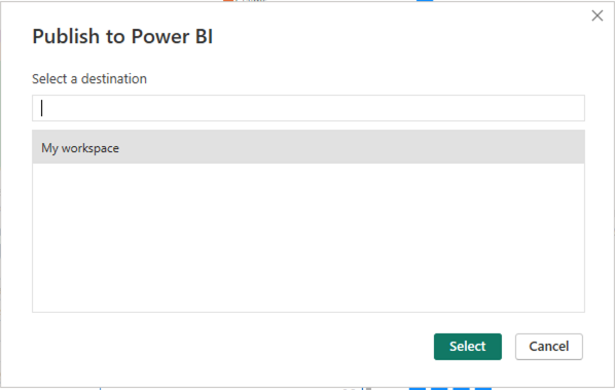
Select the publish destination.
-
The report will be published and you will be able to see the published URL.
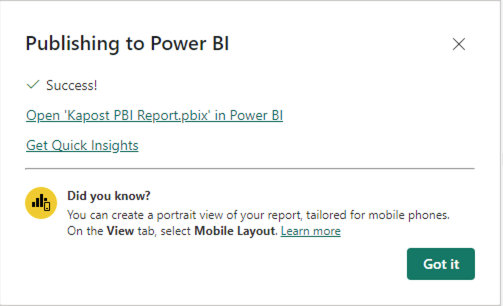
-
Click on the link to see the published report on the web.
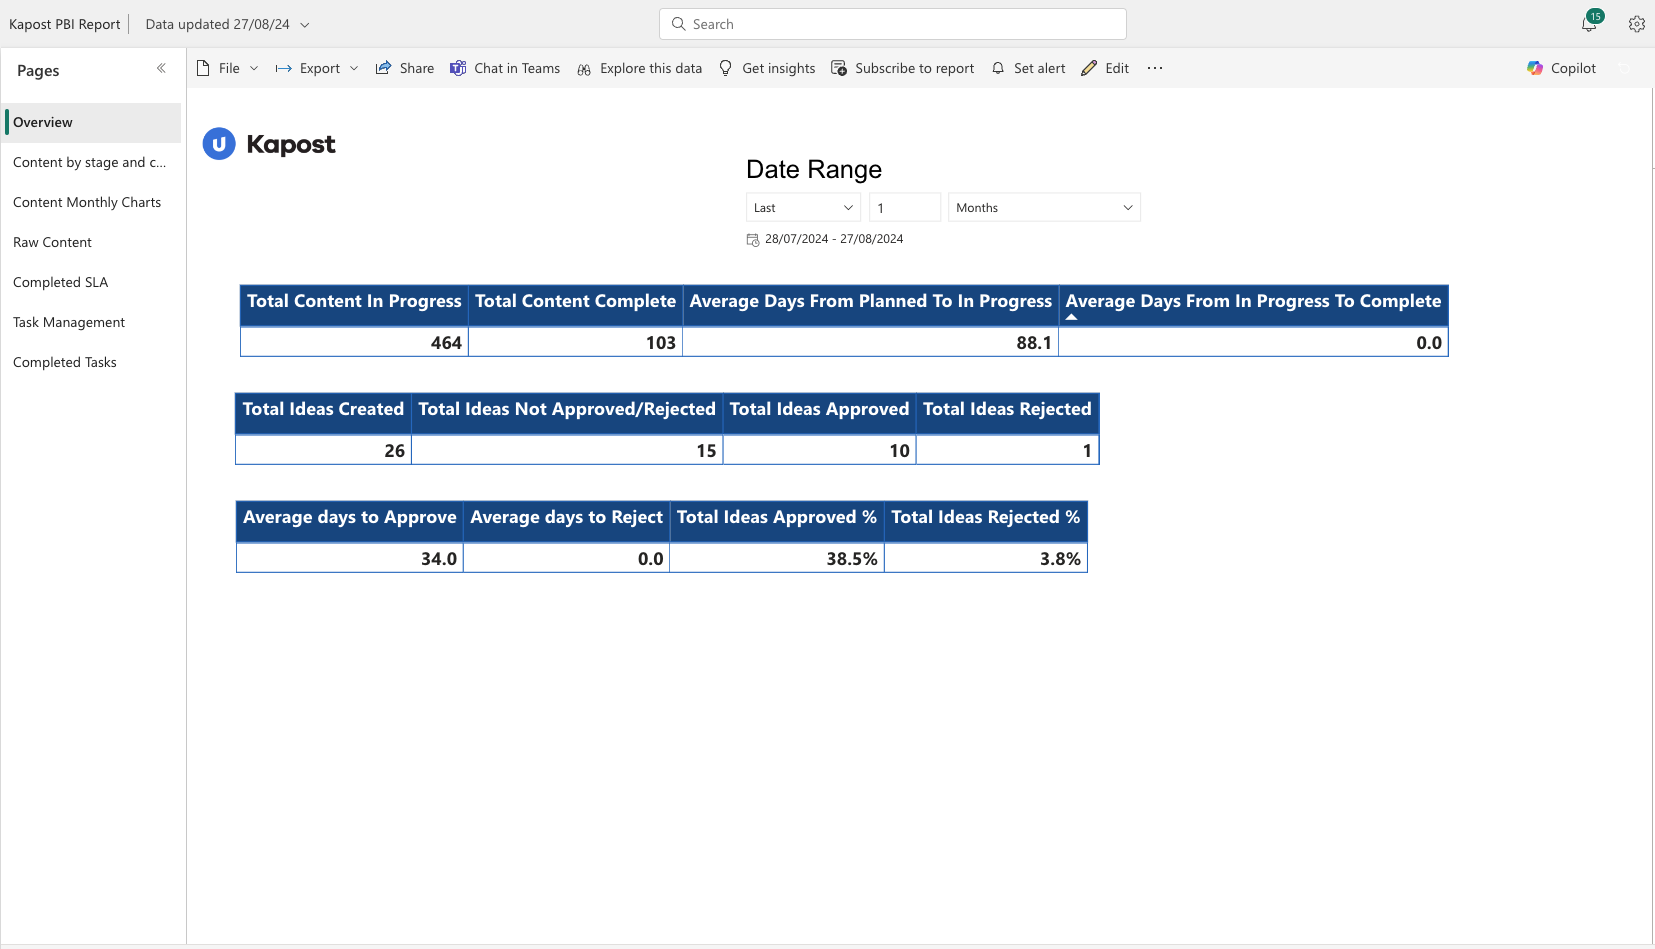
-
(Optional) Click on the Share button to share the report with your team members.
Refreshing the Data
In the Power BI App
The data in the PBI reports comes from the PBI data store and is not real-time. To update the PBI data copy, you must click on the Refresh button from the top nav bar.

Once you refresh, Power BI will reach out to Kapost and fetch the latest data.
From Power BI Service
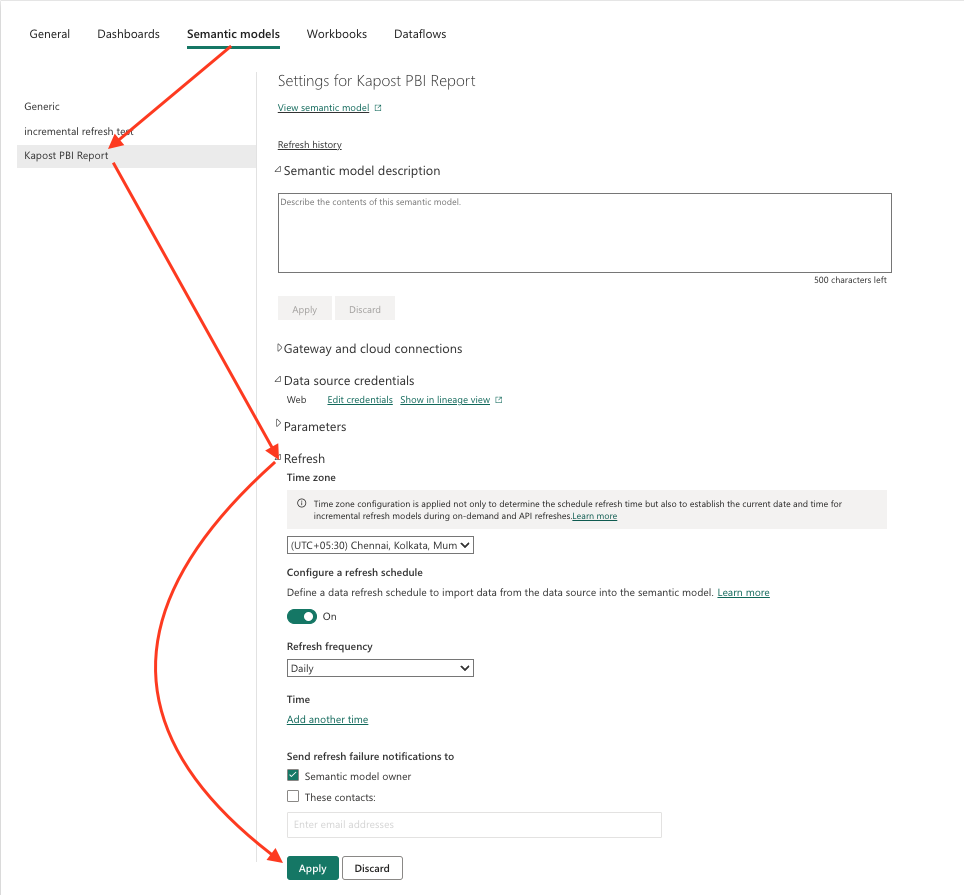
After publishing the report to Power BI, we can refresh the data from the service directly. To do this, we need to setup the credentials in the service first.
To setup the credentials, visit Power BI and follow the steps below:
-
Click on Semantic Models tab.
-
Click on the specific model that needs to be refreshed.
-
Expand Data Source Credentials and click on Edit Credentials.
-
If the URL displayed is same as your instance URL and the authentication mechanism as "Anonymous", do not make any changes.
-
Set the privacy level.
-
Click Sign In.
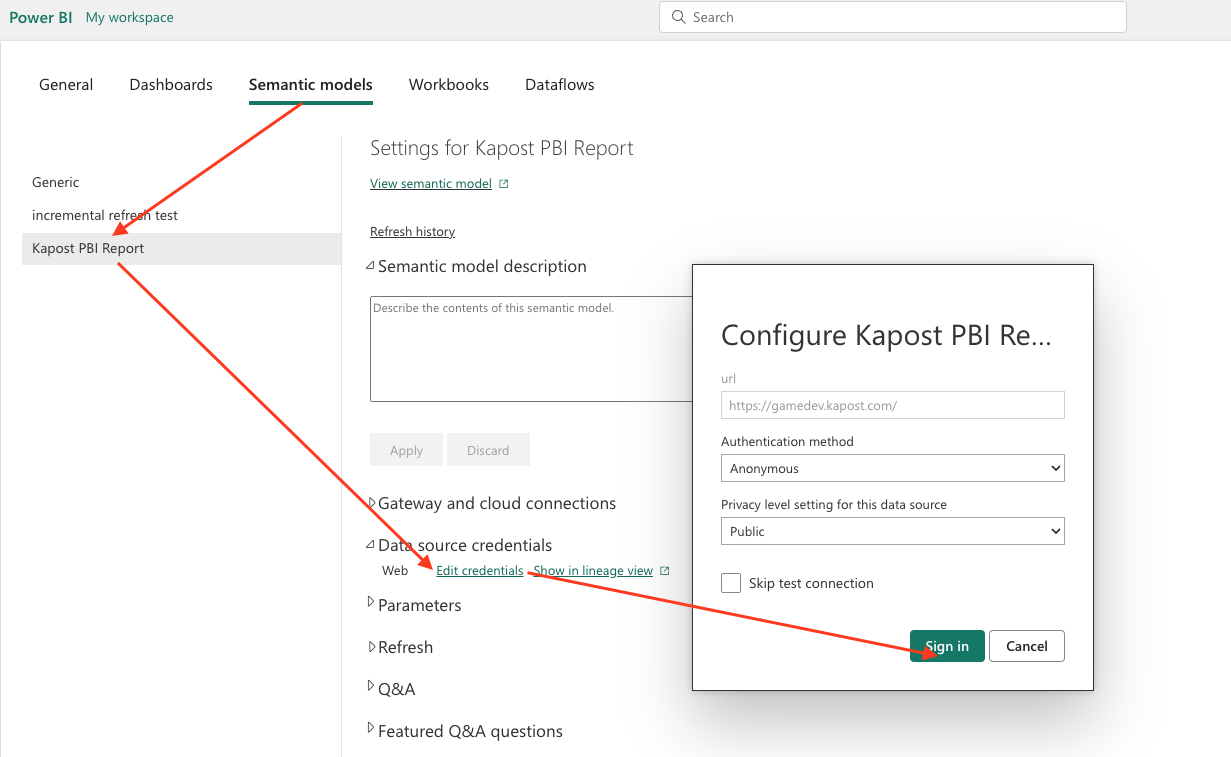
Refresh on Demand
After setting the credentials, visit Power BI and click on the semantic model that needs to be refreshed. Open the refresh menu from the top nav and click on Refresh Now.
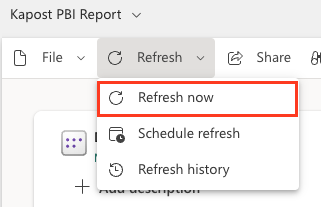
Scheduled Refresh
After setting the credentials, visit Power BI and follow the steps below:
-
Click on Semantic Models tab.
-
Click on the specific model that needs to be refreshed.
-
Expand the Refresh section and provide the schedule for the data refresh.
Embedding Power BI report in Kapost
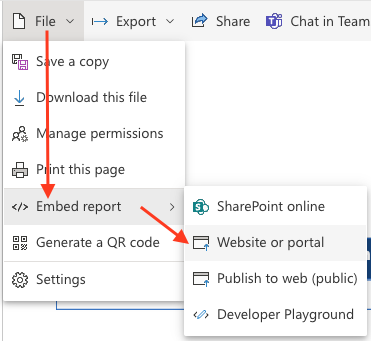
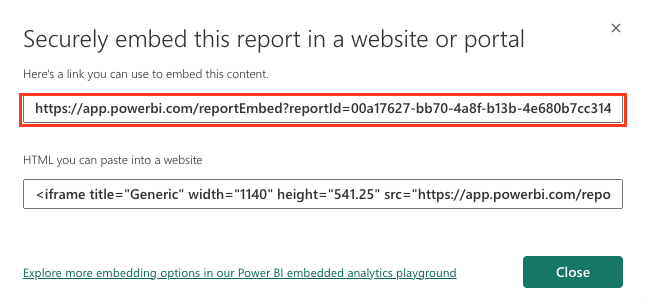
Get the Embed URL from Power BI
Visit your report in Power BI, click on File > Embed report > Website or Portal and copy the embed link.
Embedding the Report in Kapost
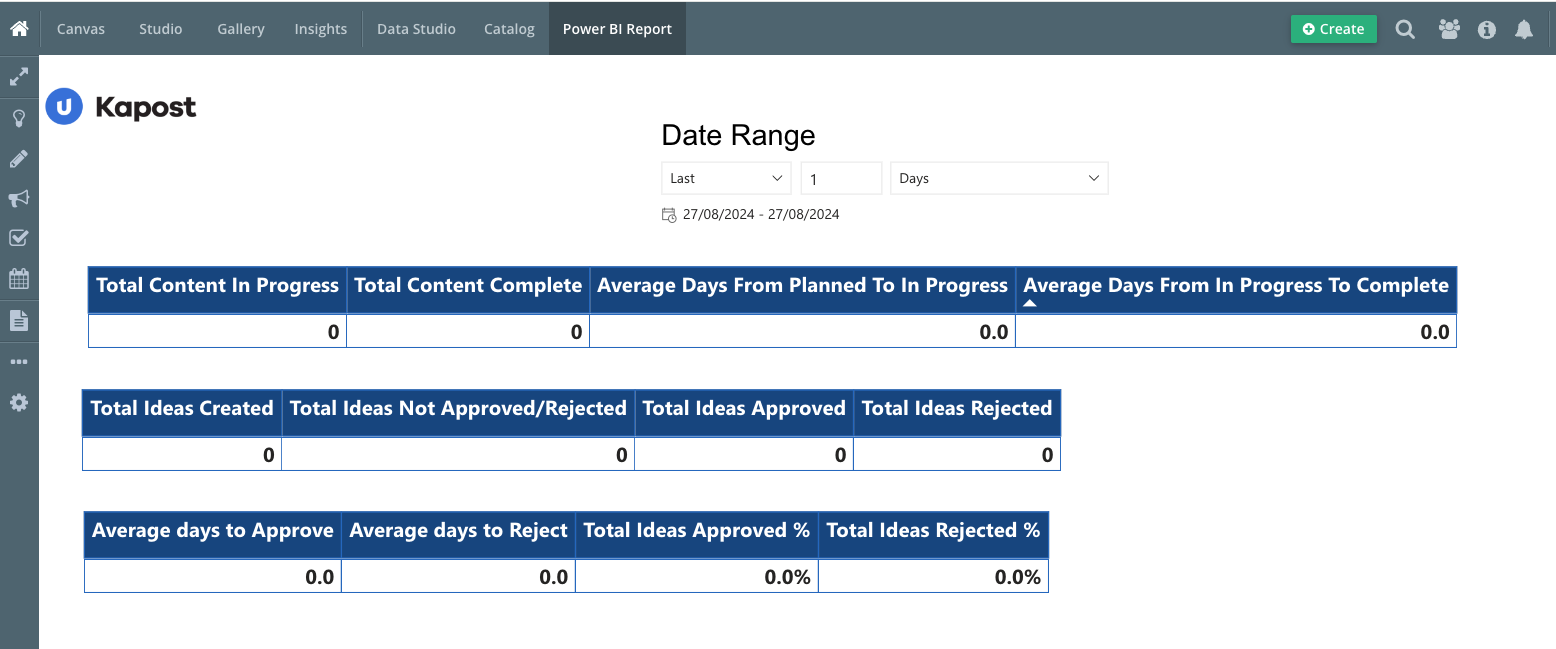
To embed the report in Kapost, go to https://{your instance}.kapost.com/settings/general, and under the Custom Links section provide the following details:
-
Name - Name of the custom link tab
-
URL - The Embed URL copied as mentioned above
-
Target - Select the Embedded or Insights option
Click Save Changes to see the Power BI report embedded in Kapost.
Sharing the Report
To share the report file, you can save the report in two formats in your desktop application - .pbit, and .pbix.
PBIT file
The PBIT file keeps your report structure and contains data schema only, instead of actual underlying report data. If you are making any structural changes to the report (additional filters/charts, etc), then you can save the report in PBIT format and share it with the team,
Note: This file will not contain your API credentials, this is a recommended way to share the report.
PBIX file
The PBIX file keeps your report structure as well as the actual report data. If you share this file with anyone, you will be also sharing the underlying data and your API credentials, and therefore, sharing this type of file is not recommended.
